Our FRIENDLY company
has good SOLUTION for you
has good SOLUTION for you
Behave with the clients as you want them to behave with you
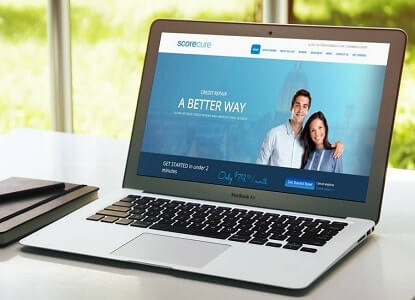
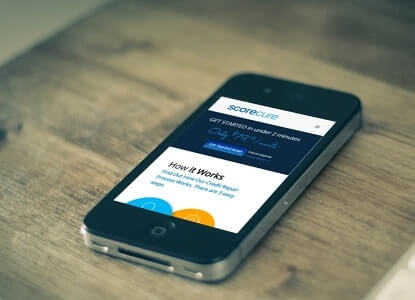
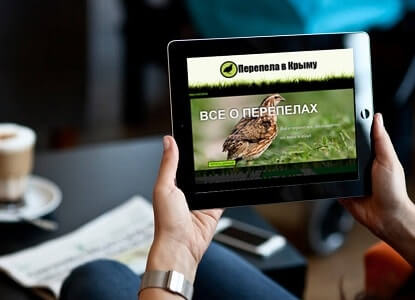
Make revolution with
your new web and mobile app!
your new web and mobile app!